Acknowledgements
This report was written by Teddy Woodhouse and edited by Lisa van Wyk. Survey analysis was conducted by Ana María Rodríguez Pulgarín. Additional comments and suggestions were provided by Catherine Nyaki Adeya, Nathalia Foditsch, Carlos Iglesias, Sonia Jorge, Onica Makwakwa, Anju Mangal, Ana María Rodríguez Pulgarín, and Eleanor Sarpong. The surveys within this report were conducted in partnership with GeoPoll.
This report was supported with financial contributions from the Alliance’s members. We are grateful for their support. Any errors remain the authors’ alone.
Suggested citation: A4AI (2022). Advancing MeaningfulConnectivity: Towards Active & Participatory Digital Societies. Alliance for Affordable Internet.
This report is made available under a Creative Commons Attribution 4.0 International (CC BY 4.0) licence. For media or other inquiries: press@webfoundation.org
Executive Summary
There is no doubt that internet access is a crucial way to learn, to bank, to access healthcare, and to stay informed. But people need more than basic internet access.
To benefit from digital technologies, people need regular access with fast speeds, enough data and sufficient devices. The Alliance for Affordable Internet (A4AI) estimates that, while two in three people are now online according to the current definition of internet access,1 billions lack the meaningful connectivity they need to make the most of the internet.
For an individual, meaningful connectivity can mean the difference between access to education, banking, and healthcare — or none of them. For a society, it can determine how realistic and how impactful digitalisation programs will be.
Furthermore, many of current and future innovations will remain out of reach for the vast majority of the population in each of these countries who remain unconnected or have only basic access.
This report advances the Meaningful Connectivity framework as a way to support more inclusive societies and strengthen digital economies. It measures the gap in the number of people with just basic internet access and those with meaningful connectivity and examines what this digital divide means for people’s online experiences.
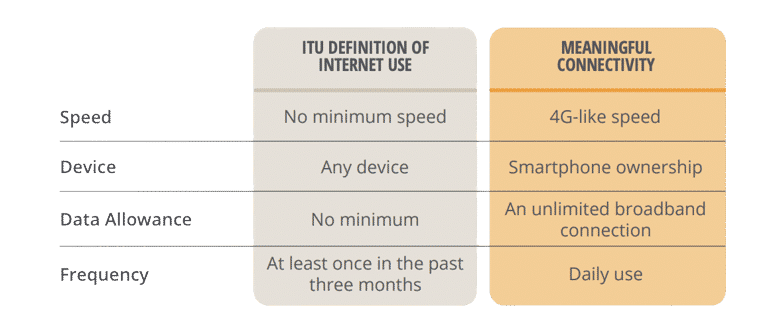
The framework focuses on four pillars: 4G-like speeds, smartphone ownership, daily use, and unlimited access at a regular location, like home, work, or a place of study.
This report looks at nine low and middle income countries (Colombia, Ghana, India, Indonesia, Kenya, Mozambique, Nigeria, Rwanda, and South Africa), using mobile phone surveys to estimate the number of people with meaningful connectivity in each.
We found that, on average, only one in ten people in these countries have meaningful connectivity. This compares with just under half who have basic internet access, by latest official figures.
- Across all nine surveyed countries, estimates of meaningful connectivity remain far behind national figures on internet use, underlining that there are large inequalities among those who are online, as well as between those with and without internet access.
- There were large variations in the number of people with meaningful connectivity in the countries we studied, ranging from one in four people in Colombia to fewer than one in 160 Rwandans.
- Consistently in all nine countries, urban internet users were more likely to have meaningful connectivity than rural internet users. The rural meaningful connectivity gap in Rwanda is 267% – meaning that Rwanda’s digital economy would need to grow another 2.5 times over exclusively in meaningfully connecting rural communities to close the urban/rural divide.
- Men who are online are more likely to have meaningful connectivity than women who are online. These disparities exist even in countries that have closed the gender gap in basic access, such as South Africa and Colombia.
Meaningful connectivity offers enormous benefits to those who have it. The survey asked respondents about their experiences online and found:
- Internet users in our surveys generally report high levels of informational confidence, suggesting that internet access, even basic access, has huge potential to share essential information and create more informed populations.
- On average, eight of ten internet users in our surveys felt confident to look up the symptoms of Covid-19 online. Over half could look up how to book a medical appointment, report a crime, and book a ticket on public transportation
- Users with meaningful connectivity were around a third more likely to do essential activities online like access healthcare, take a class, look for a job, or participate in the digital economy.
- Users with meaningful connectivity were more socially active (12% more likely to post on social media) and politically aware (13% more likely to know when the next elections are) than those with only basic access.
As governments develop their broadband policies and national digital agendas with the lessons from the Covid-19 pandemic, meaningful connectivity offers a framework to set targets and ambitions for internet access that has an impact on individuals’ lives.
Governments must prioritise reliable, affordable, and meaningful connectivity for their citizens if they are serious about securing the benefits of a digital society for everyone.
1The commonly accepted definition, from the International Telecommunication Union (ITU), is any use of the internet at any time within the past three months.
Internet access defined the pandemic
As the world grappled with the public health demands of Covid-19 stay at home orders, huge parts of human life moved online. Around 170 countries around the world adopted remote education policies (Unicef, 2020). In Indonesia, various social welfare programs transitioned to automated payments to reduce reliance on cash payments (Runkel, 2020). In South Africa, a WhatsApp bot answered questions about the pandemic and public health guidance (Matiashe, 2020). Across Brazil, people turned to online streaming services in record numbers for entertainment (Silva, 2021). In Lagos, Nigeria, the State Executive transitioned its meetings to Zoom calls (Lagos State, 2020).
From education and finance to health and governance, the internet’s value to these activities expanded to new heights. This makes being connected to the internet more important than ever before. Whereas it was once an optional luxury, internet access became a crucial way to learn, to bank, to access healthcare, and to stay informed.
However, this experience has not been equal: just as many people and activities have moved online over the past two years, millions have been excluded. By the latest ITU estimates, 4.9 billion people around the world use the internet: at the other end, nearly 3 billion people have never used the internet (ITU, 2021).2 Within this, people living in countries with lower average incomes are less likely to use the internet, just as the digital gender gap and urban-rural digital divide also mean that women and those in rural and remote areas are also less likely to use the internet (ITU, 2021; GSMA, 2021).
These inequalities in access compound offline and online to further exclude those already marginalised. The Covid-19 pandemic accelerated this negative side just as it accelerated the positives. For example, in education, despite widespread policy efforts towards remote education, these technologies remained inaccessible to an estimated 463 million children (Unicef, 2020). The consequential missed schooling poses long-term risks for their education, psychological development, and economic prospects — that millions of other children did not face because of their access to the internet (Unesco, 2021).
In the context of gender, the Women’s Rights Online programme has tracked this development over time. In 2015, it reported that women with internet access were less likely to look for a job or post their political views (Web Foundation, 2015). In expanded national surveys in 2020, women online were once again less likely than men to post their views or to sell/advertise a product/service online (Web Foundation, 2020).
Internet users themselves recognise the value of their access through the pandemic. In a survey of 1,000 mobile internet users in each of nine low and middle income countries in 2021, vast majorities in many countries said their experiences of the Covid-19 pandemic would be worse without internet access. In Kenya, Mozambique, and Nigeria, for each person that said their life would have been better without the internet, another thirteen projected their life would have been worse.
Figure 1. Internet users’ perceived lockdown experience if they had no internet access (as % of respondents)
As governments think about their post-pandemic policy agendas, they must prioritise reliable and quality connectivity for their citizens if they are serious about securing the benefits of a digital society to all their people. For an individual, it can mean the difference between access to education, banking, and healthcare — or none of them. For a society, internet access can determine how realistic and how impactful digitalisation programs will be. The Meaningful Connectivity framework offers a means to do this.
2Details on how this indicator is collected and its limitations are discussed on page 8.
The post-Covid broadband policy agenda: aiming for meaningful connectivity
A4AI launched the Meaningful Connectivity framework in 2019 to address shortcomings in how internet access has been measured and defined in recent years (A4AI, 2019). The framework focuses on four pillars: 4G-like speeds, smartphone ownership, daily use, and unlimited access at a regular location, like home, work, or a place of study. This allows for a deeper understanding of access compared to the ITU’s definition of connectivity, which includes cases of limited connectivity such as the one experienced when using a feature phone, with limited functionality, on a low-speed bandwidth connection (ITU, 2021).
This depth of the Meaningful Connectivity framework enables policymakers to more readily identify connectivity bottlenecks and prioritise key investments to increase the internet’s potential impact.
In the initial design of the framework, each pillar of the framework relates to additional capacities and user behaviours we found through our research (A4AI, 2020). For speed, this connects to the expanded use of video and users’ preferences for audiovisual material.
Smartphones come with the added functionality of a camera, a tactile screen, and mobility. Many users rely on an ‘oasis’ point in their daily lives — for example at home, work, or school — to conduct data-heavy activities that they couldn’t necessarily do anywhere. Finally, daily use reflects the capacity of this technology to transform and become a meaningful part of someone’s life.
Our first application of the Meaningful Connectivity framework took place in 2020 with the Women’s Rights Online report, and the indicators within that report exposed a wide gap between the simple binary of internet use and the deeper measures of meaningful connectivity. In household surveys of Colombia, Ghana, and Indonesia, no more than two-thirds of internet users had meaningful connectivity (Web Foundation, 2020). In addition, in contexts where digital gender gaps in internet use were nearly non-existent, gender gaps as large as 16% emerged for meaningful connectivity (ibid). This helps indicate that what has worked to date has left deep inequalities under superficial measurements and that a new generation of policy interventions is required to achieve universal access.
Various stakeholders in several parts of the world have started to embed the Meaningful Connectivity framework into the broadband policy dialogue. The framework offered the basis for measurements of urban-rural connectivity divides across Latin America (see IICA, 2020). Meaningful connectivity has been used to understand the landscape across Asia and the Pacific for broadband investment (see UNESCAP-A4AI, 2021). The framework has also become a key point for collaborations between A4AI and Smart Africa (Smart Africa, 2020). This represents a wide range of initial steps for the framework’s potential inclusion at additional levels in the policy process.
Substantial work remains in developing the concept and embedding it across different aspects of broadband policy. A4AI, as initial advocates for meaningful connectivity, has also undertaken a range of activities to develop the framework, including a methodology guide and policy playbook (A4AI, 2021; A4AI, 2021). This report builds on the foundations of this work to expand the measurements of meaningful connectivity to new countries and to understand the impacts of this connectivity in everyday lives.
What is meaningful connectivity, and how do we measure it?
Meaningful connectivity is a proposed framework for measuring qualities of internet access in an area. It focuses on four pillars:
4G-LIKE
INTERNET SPEEDS

SMARTPHONE
OWNERSHIP

AN UNLIMITED BROADBAND
CONNECTION AT HOME,
WORK, OR PLACE OF STUDY

DAILY USE
It suggests replacing the existing top-level measure of internet use – defined as access on any device at least once in the past three months (see ITU, 2020) — as the lead indicator for connectivity within a country. Through the four, focused pillars, the framework offers guiding priorities for policymakers to focus their interventions through public investment, regulatory reform, and vision-setting to achieve universal, affordable, and meaningful internet access (A4AI, 2021).
The framework is built around two measures: the number of people within a country with meaningful connectivity and the National Assessment for Meaningful Connectivity.3 This report focuses on the number of people within these countries that have meaningful connectivity: that is, that have all four of the elements mentioned above. The National Assessment is a policy tool to help a country measure progress over time and brings together an average of the four pillars for a net national score.
3Details on the precise calculation of each are available in the Meaningful Connectivity Methodology Guide (A4AI, 2021)
Mobile surveys to measure meaningful connectivity
The first measurements of meaningful connectivity and the first edition of the methodology guide relied primarily on household surveys as the base method for measuring meaningful connectivity. This mirrors ITU’s best practices for measuring other internet access related indicators (ITU, 2020). However, this method is, first, very costly and, second, poses unique challenges in the context of the Covid-19 pandemic (UN DESA, 2020).
As such, this report is a first test for a new method to provide a lower cost intervention to estimate meaningful connectivity within a country: namely, mobile phone-based, computer-assisted telephone interviewing (CATI).
RESEARCH SCOPE
The Alliance worked in partnership with GeoPoll, a full-service research provider and mobile surveying platform, to conduct surveys in June-July 2021 in nine low and middle income countries.
Each survey included at least 1,000 respondents, each of whom was an internet user with a mobile phone. Each national sample had quotas set around first-level administrative districts (or clusters thereof), along with controls for gender and geographic diversity based
on the latest available demographic data of internet users within the country.4
Table 1. Sampling Plan for A4AI Meaningful Connectivity Survey
| COUNTRY | RANGE FOR NON-MALE RESPONDENTS5 | ACTUAL NON-MALE RESPONDENTS | RANGE FOR RURAL RESPONDENTS | ACTUAL RURAL RESPONDENTS | TOTAL RESPONDENTS |
|---|---|---|---|---|---|
| Colombia | 498–500 | 500 | 83–125 | 110 | 1000 |
| Ghana | 425–500 | 500 | 194–292 | 207 | 1000 |
| India | 266–500 | 499 | 428–642 | 509 | 1000 |
| Indonesia | 467–500 | 499 | 284–426 | 357 | 1000 |
| Kenya | 411–500 | 477 | 497–745 | 594 | 1000 |
| Mozambique | 401–500 | 487 | 339–509 | 355 | 1000 |
| Nigeria | 393–500 | 478 | 258–386 | 291 | 1000 |
| Rwanda | 348–500 | 482 | 488–732 | 638 | 1000 |
| South Africa | 435–500 | 500 | 202–304 | 258 | 1000 |
This sampling plan ensures a voice for historically underrepresented groups: namely, women and people living in rural areas. However, it does limit some of the possible uses of the data. For example, this survey gives us no indication about changes in internet use in a country or within particular parts of a country. Those numbers are assumed as parts of the sampling plan.
From this method of mobile-based surveys, we can make well-informed projections about the extent of meaningful connectivity in a country. By ensuring a cross-representative sample of users and their access patterns across the country, this survey can tell us about the kind of access that a specific subset within the country — mobile internet users — has. If we apply our understanding from the survey exclusively to that population, the survey can give us some estimates on the availability of meaningful connectivity in that country.
ASSUMPTIONS AND LIMITATIONS
This method of mobile phone surveys relies on a few assumptions and has some limitations.
It logically assumes that someone that does not use the internet does not have meaningful connectivity. Given that meaningful connectivity measures a specific quality of internet access, this assumption poses no problem. As long as the references for the assumed sampling plan are accurate, the exclusion of this group from any measure of meaningful connectivity should still be accurate.
Given that this survey relied on mobile phone users, it omits a potential, small number of internet users who only connect using devices other than a mobile phone. This use case was exceedingly rare in the first round of household surveys for meaningful connectivity (Web
Foundation, 2020). While it is a known omission and limitation of this survey, its potential impact is very limited in scope.
This survey set did not ask for respondents’ level of education, economic class, ethnicity, or language spoken at home. These are factors that we know contribute to the odds that someone is using the internet (GSMA, 2021), and we estimate they may also contribute to the odds that someone has meaningful connectivity rather than basic access. As our survey does not ask for this information, we cannot be certain that these factors have not biased the sample in a particular way. Indeed, given our experience with similar datasets from similar surveys (A4AI, 2021), we anticipate that income levels are a hidden influence throughout much of our dataset: those with meaningful connectivity likely also have higher average incomes than the rest of our sample.
Other factors may apply to mobile phone surveys in general, including nonresponse rates and refusals (Ambel, et alia, 2021). Details of these numbers are available as Annex 2.
In short, this method is not a full replacement for household surveys and other methods that are typically employed to collect these indicators. However, in resource-constrained contexts and with an understanding of these limitations, mobile phone-based surveys can give us informed estimates of meaningful connectivity that can help guide policy decisions in the right direction through an understanding of general trends.
5In the survey design, respondents were asked their gender, and enumerators were directed to identify the respondents’ answers as Male, Female, or Any Other Answer. Due to insufficient responses that would prevent sampling bias to overwhelm averages for the third group, those with Any Other Answer have been excluded from gender-based disaggregations.
Results: meaningful connectivity remains beyond the means of many
Across all nine surveyed countries, estimates of meaningful connectivity remain far behind national figures on internet use. The method used to create these estimates assume that the meaningfully connected will represent only a fraction of all internet users: however, these surveys reveal the depth of the disparities between basic access and meaningful connectivity in a country.
Meaningful connectivity ranges from being the experience of around one in every four Colombians to less than one of every 160 Rwandans.
This reveals a deeper inequality of access that runs within South Africa compared to Colombia and in Ghana compared to Nigeria. Despite both country pairs having similar levels of internet use at the national level, only an estimated 13% of South Africans (one of
every five internet users) have meaningful connectivity compared to 26% of Colombians (two of every five internet users). In Ghana, only 7% of Ghanaians have meaningful connectivity compared to 12% of Nigerians.
Figure 2. Estimated meaningful connectivity, per survey country (as projected % of population)
WHAT GENDER AND GEOGRAPHY MEAN FOR CONNECTIVITY
Consistently in all nine countries, urban internet users were more likely to have meaningful connectivity than rural internet users, and men online were more likely to have meaningful connectivity than women online.
Of the four pillars of meaningful connectivity — 4G-like speeds, smartphone ownership, unlimited internet access point, and daily use — 4G access and an unlimited access point were the least common features of meaningful connectivity in these nine countries. In turn, these two pillars are controlling factors in the gaps between men and women and urban and rural internet users.
These inequalities not only mirror internet use but also expose the depth of inequality well beyond them. Just as economic and social barriers discourage women’s internet use in certain parts of the world (A4AI, 2021), these barriers would apply even more acutely on a woman’s use of her disposable income on more expensive, higher-quality internet access. In addition, where geography and return on investment may discourage adequate internet infrastructure in a rural or remote community (A4AI, 2020), these communities may lag behind the national average in access and use of newer, faster technologies. The meaningful connectivity framework helps to evidence this inequality
Table 2. Estimates of meaningful connectivity, by country, geography, and gender
| COUNTRY | NATIONAL | URBAN | RURAL | Men | WOMEN |
|---|---|---|---|---|---|
| Colombia | 26.2% | 30.5% | 7.6% | 33.8% | 19.2% |
| Ghana | 6.5% | 9.0% | 2.8% | 8.3% | 4.8% |
| India | 6.8% | 9.0% | 5.3% | 9.8% | 3.3% |
| Indonesia | 12.7% | 15.3% | 9.1% | 12.8% | 10.4% |
| Kenya | 10.9% | 20.7% | 6.5% | 14.3% | 7.7% |
| Mozambique | 3.6% | 6.7% | 1.5% | 4.2% | 2.7% |
| Nigeria | 12.1% | 16.4% | 6.6% | 15.5% | 7.2% |
| Rwanda | 0.6% | 1.9% | 0.3% | 0.5% | 0.2% |
| South Africa | 12.8% | 15.9% | 5.7% | 16.4% | 12.1% |
These estimates of meaningful connectivity demonstrate the value of this framework: adding detail to understand the digital divide and the risks of continued inequality and inaction. This method has limitations that do not suggest a perfect capture of the state of connectivity in a country: however, it can give a more affordable evidence base to understand the general trends of internet access, where inequalities lie, and how they manifest within a country. This information, while not perfect, helps inform the context in which broadband policy decisions are made.6
Figure 3. Geography and gender gaps, by internet use and meaningful connectivity
6Detailed gap information and gap calculation methods are discussed in Annex 3.
Meaningful connectivity can help governments accelerate their achievement of the Sustainable Development Goals
The internet has enabled so much of human life to move online, but this transition has been inherently unequal. According to factors such as gender, geography, income, age, and education level, internet access has been an accelerant for economic and social progress for those who have been able to connect and stay connected. However, too few have meaningful connectivity that enables them not only to access the world’s information but act upon it. Our policies, our targets, and our methods need to change.
This report provides the first demonstration of how to systematically measure meaningful connectivity and what are some of the benefits for those who have this kind of internet access. Only by collecting this data, at a level of granularity hidden underneath the top-level binary of internet access, are policymakers able to understand the relationship between investments in better access and the better social and economic outcomes it can produce.
This report focuses on measuring the individual benefits of meaningful connectivity. This evidence, from nine low and middle income countries, demonstrates the enormous potential to empower people to act once meaningfully connected. These actions relate to the Sustainable Development Goals: with meaningful connectivity, people are more likely to access healthcare, look for employment, take a class, and participate in the digital economy.
If the Covid-19 pandemic was the test of the importance of internet access to modern human life, the years after will be the test of governments to invest in expanding that potential.
The meaningful connectivity framework offers a model to do just that.
Annex 1: Sampling plan details
Each national sample had quotas set around first-level administrative districts (or clusters thereof), along with controls for gender and geographic diversity based on the latest available demographic data of internet users within the country.
Columbia
| RANGE FOR NON-MALE RESPONDENTS | RANGE FOR RURAL RESPONDENTS |
|---|---|
| 498–500 | 83–125 |
| REGION | AREAS INCLUDED | RESPONDENTS RANGE |
|---|---|---|
| 1 | Amazonas, Caquetá, Cauca, Guainía, Guaviare, Huila, Meta, Nariño, Putumayo, Vaupés, Vichada | 96–160 |
| 2 | Atlántico, Bolívar, Cesar, Córdoba, La Guajira, Magdalena, San Andrés y Providencia, Sucre | 170–284 |
| 3 | Arauca, Bogotá, Boyacá, Casanare, Cundinamarca, Norte de Santander, Santander | 251–418 |
| 4 | Antioquia, Caldas, Chocó, Quindío, Risaralda, Tolima, Valle del Cauca | 233–388 |
Ghana
| RANGE FOR NON-MALE RESPONDENTS | RANGE FOR RURAL RESPONDENTS |
|---|---|
| 425–500 | 194–292 |
| REGION | AREAS INCLUDED | RESPONDENTS RANGE |
|---|---|---|
| 1 | Eastern, Greater Accra, Volta | 249–415 |
| 2 | Central, Western, Western North | 140–233 |
| 3 | Ahafo, Ashanti, Bono, Bono East | 214–357 |
| 4 | North East, Northern, Oti, Savannah, Upper East, Upper West | 147–245 |
India
| RANGE FOR NON-MALE RESPONDENTS | RANGE FOR RURAL RESPONDENTS |
|---|---|
| 266–500 | 428–642 |
| REGION | AREAS INCLUDED | RESPONDENTS RANGE |
|---|---|---|
| 1 | Chandīgarh, Delhi, Haryāna, Himāchal Pradesh, Jammu & Kashmīr, Ladakh, Punjab, Rājasthān, Dādra & Nagar Haveli & Damān & Diu, Goa, Gujarāt, Mahārāshtra | 202–337 |
| 2 | Chhattīsgarh, Madhya Pradesh, Uttarākhand, Uttar Pradesh | 199–332 |
| 3 | Arunāchal Pradesh, Assam, Manipur, Meghālaya, Mizorām, Nāgāland, Tripura, Sikkim, Bihār, Jhārkhand, Odisha, West Bengal | 198–329 |
| 4 | Andhra Pradesh, Karnātaka, Kerala, Puducherry, Tamil Nādu, Telangana | 151–251 |
Indonesia
| RANGE FOR NON-MALE RESPONDENTS | RANGE FOR RURAL RESPONDENTS |
|---|---|
| 467–500 | 284–426 |
| REGION | AREAS INCLUDED | RESPONDENTS RANGE |
|---|---|---|
| 1 | Banten, Jakarta, West Java | 196–327 |
| 2 | Central Java, East Java, Yogyakarta | 224–374 |
| 3 | Central Kalimantan, East Kalimantan, North Kalimantan, South Kalimantan, West Kalimantan, Maluku, North Maluku, Papua, West Papua | 70–117 |
| 4 | Bali, Central Sulawesi, East Nusa Tenggara, Gorontalo, North Sulawesi, South Sulawesi, Southeast Sulawesi, West Nusa Tenggara, West Sulawesi | 97–161 |
| 5 | Aceh, Bangka Belitung, Bengkulu, Jambi, Lampung, North Sumatra, Riau, Riau Islands, South Sumatra, West Sumatra | 163–271 |
Kenya
| RANGE FOR NON-MALE RESPONDENTS | RANGE FOR RURAL RESPONDENTS |
|---|---|
| 411–500 | 497–745 |
| REGION | AREAS INCLUDED | RESPONDENTS RANGE |
|---|---|---|
| 1 | Embu, Kirinyaga, Laikipia, Murang’a, Nyandarua, Nyeri, Kiambu, Nairobi, Kajiado, Kitui, Machakos, Makueni | 247–412 |
| 2 | Isiolo, Marsabit, Meru, Tharaka-Nithi, Garissa, Mandera, Wajir, Kilifi, Kwale, Lamu, Mombasa, Taita-Taveta, Tana River | 150–249 |
| 3 | Elgeyo-Marakwet, Nandi, Trans Nzoia, Turkana, Uasin Gishu, West Pokot, Baringo, Bomet, Kericho, Nakuru, Narok, Samburu | 175–292 |
| 4 | Bungoma, Busia, Kakamega, Vihiga, Homa Bay, Kisii, Kisumu, Migori, Nyamira, Siaya | 178–297 |
Mozambique
| RANGE FOR NON-MALE RESPONDENTS | RANGE FOR RURAL RESPONDENTS |
|---|---|
| 401–500 | 339–509 |
| REGION | AREAS INCLUDED | RESPONDENTS RANGE |
|---|---|---|
| 1 | Maputo, Maputo Cidade | 83–138 |
| 2 | Gaza, Inhambane | 78–130 |
| 3 | Manica, Sofala, Tete | 184–307 |
| 4 | Nampula, Zambézia | 294–489 |
| 5 | Cabo Delgado, Niassa | 111–185 |
Nigeria
| RANGE FOR NON-MALE RESPONDENTS | RANGE FOR RURAL RESPONDENTS |
|---|---|
| 393–500 | 258–386 |
| REGION | AREAS INCLUDED | RESPONDENTS RANGE |
|---|---|---|
| 1 | Ekiti, Lagos, Ogun, Ondo, Osun, Oyo | 148–247 |
| 2 | Akwa Ibom, Bayelsa, Cross River, Delta, Edo, Rivers | 112–187 |
| 3 | Abia, Anambra, Ebonyi, Enugu, Imo | 88–146 |
| 4 | Benue, Federal Capital Territory, Kogi, Kwara, Nasarawa, Niger, Plateau | 109–181 |
| 5 | Jigawa, Kaduna, Kano, Katsina, Kebbi, Sokoto, Zamfara | 192–320 |
| 6 | Adamawa, Bauchi, Borno, Gombe, Taraba, Yobe | 101–169 |
Rwanda
| RANGE FOR NON-MALE RESPONDENTS | RANGE FOR RURAL RESPONDENTS |
|---|---|
| 348–500 | 488–732 |
| REGION | AREAS INCLUDED | RESPONDENTS RANGE |
|---|---|---|
| 1 | Eastern | 185–309 |
| 2 | Kigali, Northern | 204–340 |
| 3 | Western | 176–294 |
| 4 | Southern | 185–308 |
South Africa
| RANGE FOR NON-MALE RESPONDENTS | RANGE FOR RURAL RESPONDENTS |
|---|---|
| 435–500 | 202–304 |
| REGION | AREAS INCLUDED | RESPONDENTS RANGE |
|---|---|---|
| 1 | Eastern Cape, Western Cape | 173–288 |
| 2 | Free State, Northern Cape, North West | 104–174 |
| 3 | Gauteng | 194–323 |
| 4 | KwaZulu-Natal | 144–240 |
| 5 | Limpopo, Mpumalanga | 135–225 |
Annex 2: Survey production statistics, by country
| COLOMBIA Count % | GHANA Count % | INDIA Count % | |
|---|---|---|---|
| Surveys Sent | 12936 100% | 5048 100% | 5322 100% |
| Opt ins | 1474 11% | 1173 23% | 1282 24% |
| Completes | 1000 8% | 1000 20% | 1008 19% |
| Dropoffs | 406 3% | 95 2% | 144 3% |
| Refusals | 1523 12% | 486 10% | 1067 20% |
| Ineligible | 68 1% | 78 2% | 130 2% |
| Nonresponse | 9939 77% | 3389 67% | 2973 56% |
| INDONESIA Count % | KENYA Count % | MOZAMBIQUE Count % | |
|---|---|---|---|
| Surveys Sent | 6259 100% | 5218 100% | 11536 100% |
| Opt ins | 1190 19% | 1182 23% | 1274 11% |
| Completes | 1000 16% | 1000 19% | 1000 9% |
| Dropoffs | 61 1% | 64 1% | 108 1% |
| Refusals | 1368 22% | 626 12% | 1413 12% |
| Ineligible | 129 2% | 118 2% | 166 1% |
| Nonresponse | 3701 59% | 3410 65% | 8849 77% |
| NIGERIA Count % | RWANDA Count % | SOUTH AFRICA Count % | |
|---|---|---|---|
| Surveys Sent | 3618 100% | 10773 100% | 6466 100% |
| Opt ins | 1103 30% | 1381 13% | 1400 22% |
| Completes | 1000 28% | 1000 9% | 1000 15% |
| Dropoffs | 82 2% | 107 1% | 336 5% |
| Refusals | 295 8% | 683 6% | 842 13% |
| Ineligible | 21 1% | 274 3% | 64 1% |
| Nonresponse | 2220 61% | 8709 81% | 4224 65% |
Annex 3: Connectivity gaps and calculation methods
As part of this report, the Alliance is reporting the geography and gender gaps in internet use and in meaningful connectivity as follows.
Table 4. Geography and gender gaps, by internet use and meaningful connectivity
| COUNTRY | GEOGRAPHY GAP, BY INTERNET USE | GEOGRAPHY GAP, BY MEANINGFUL CONNECTIVITY | GENDER GAP, BY INTERNET USE | GENDER GAP, BY MEANINGFUL CONNECTIVITY |
|---|---|---|---|---|
| Colombia | 56% | 87% | 5% | 76% |
| Ghana | 76% | 95% | 31% | 73% |
| India | 56% | 54% | 155% | 197% |
| Indonesia | 52% | 49% | 12% | 23% |
| Kenya | 49% | 130% | 45% | 86% |
| Mozambique | 89% | 144% | 58% | 56% |
| Nigeria | 67% | 81% | 50% | 115% |
| Rwanda | 151% | 267% | 88% | 150% |
| South Africa | 35% | 80% | 33% | 36% |
These gaps are calculated by the Alliance, based on data from a wide array of sources. The rates of meaningful connectivity are calculated by the Alliance for Affordable Internet, 2021, based on projections from our survey data in relation to mobile internet users. Internet use rates by gender were informed by the Inclusive Internet Index, 2021, for all countries. Rurality rates were from World Bank, 2021, and internet use in urban/rural areas were based on a variety of latest available reliable data sources, details individually by country in Annex 1.
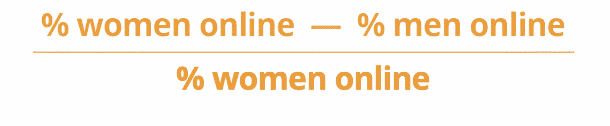
We calculate geography gaps and gender gaps differently.
Since 2018, A4AI has used a women-centric calculation for gender gaps (A4AI, 2018). This is so that we can frame the size of the gap not in terms of what women must in relation to men’s experiences, but what must change in women’s experiences to reach gender equality. In, short, the equation we use is:
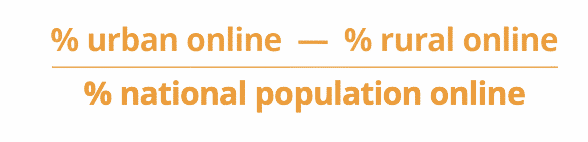
Starting with this report, the Alliance will report geography gaps (that is, the difference between urban and rural access) as a percentage of the national average. This strategy is taken for two key reasons: national context and policy relevance.
Geography and gender affect the national policy context in unique ways. Across the globe, countries have much less variance in their gender ratio than in their degrees of rurality (cf. Our World in Data, 2019, and World Bank, 2021). Connected to this, high variance in the gender ratio from the average usually correlates with public policy and social norms that impose a preference for men over women and for boys over girls (Our World in Data, 2019; UNDP, 2020). We do not have evidence for the same explicit correlation between public policy and degrees of rurality. This variance means we expect these numbers — between gender and geography — to behave differently.
In line, this new calculation method for geography gaps guides policy relevance in relation to the degree of rurality in that country. Between two countries where the percentage point difference between urban and rural internet use is identical, a country with a larger rural population will have a larger reported geography gap than a highly urbanised country. This calculation method, then, nudges policymakers responsively towards the greatest good: where there are more rural people, the urgency of the geography gap becomes more pressing in the report statistics.